This session was streamed live via livestream on 31 May 2011
Abstract (taken from the History SPOT blog)
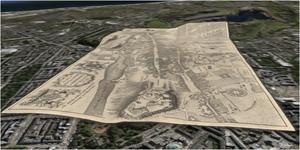
If you suggest using GIS (geographical information system) to an historian they might look back at you blankly or with a look of mild horror on their face. For many historians GIS is viewed (not unfairly) as a complicated tool best left to others. However, its potential usefulness in answering and revealing research questions is pretty much indisputable. Richard Rodger wants to show that working on the spatial does not necessarily require GIS work and where it does, it is often highly rewarding. In this paper Rodger wants to look at alternatives to GIS, to more simple processes for investigating the spatial. He does this not just with the academic historian in mind, but also the local historian, the student, and other interested researchers. Using pre-established geo-referencing tools and by following straight forward techniques can be highly rewarding and relatively easy to learn. Take the Google Maps platform as an example. Rodger describes in this paper how to use Google tools to map spatially various statistical data with minimum of effort. Then there is his own project, Visualising Urban Geographies, which uses Edinburgh as a template for building mapping tools specifically designed for use by historians. By investigating data by addresses or districts, this project allows historians to create spatial boundaries to link maps to the boundaries of data. In other words a set of district records can be mapped accurately and displayed in a way useful for interpretation.
Rodger wants everyone to be able to investigate the spatial and emphasises that it does not necessarily need to be complicated or time consuming.
Resources:
Richard Rodger profile
Visualising Urban Geographies project website
Video Podcast:
(This video is an edited version from that stream. For the original unedited version see our Past live stream pages)
Audio Podcasts
