Plague in London: Spatial and Temporal Aspects of Mortality
Graham Twigg
Part of the online series Epidemic Disease in London published by the Centre for Metropolitan History
Epidemic Disease in London ed. J.A.I. Champion (Centre for Metropolitan History Working Papers Series, No.1, 1993): pp. 1-17 ( © Graham Twigg 1993 )
Introduction
The retrospective identification of diseases in the distant past is a task with many pitfalls and this is especially true when bubonic plague is the subject. The difficulty comes about not so much on account of the physical symptoms, although even buboes may appear in some other diseases, but because the use of the term 'plague', in the sense of high mortality, and 'plague' meaning true Oriental or bubonic plague, has become so blurred that bubonic plague has become accepted as the chief, if not on occasion the sole, cause of epidemic disease in Britain between 1348 and 1665.
Such domination must arouse curiosity because bubonic plague is after all a tropical disease and in order to produce epidemics it requires a temperature of at least 70 degrees F. (21 degrees C.) for a period of several weeks and two warm adapted, and hence environmentally restricted, vectors in the black rat, Rattus rattus, and the rat flea, Xenopsylla cheopis.
In a cool temperate climate, especially during a cold era such as the period under discussion, the conditions for epidemic plague would not have occurred with the frequency nor the geographical and seasonal freedom that many accounts of plague exhibited. A failure to acknowledge these limitations on the part of plague has led to a tendency to adjust the biology of the disease and its vectors beyond their natural limits in order to accommodate circumstances where plague was highly unlikely to occur, thus making a historical necessity out of a biological improbability.
This fixity of Oriental plague as 'the truth' led even J.F.D. Shrewsbury (1) to postulate a situation of plague entry and spread in London that ignored both the known logistics of plague diffusion and the data from the parish registers, when a more careful study would have revealed a different state of affairs.
Fig. 1. The Study Parishes
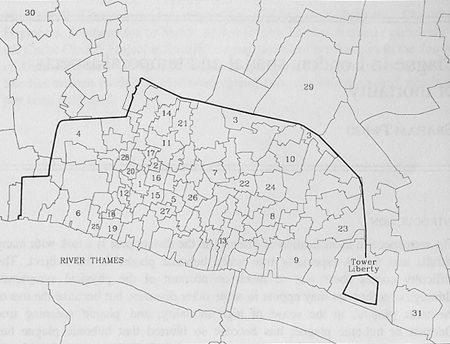
- All Hallows Bread Street
- All Hallows Honey Lane
- All Hallows London Wall
- Christ Church Newgate Street
- St Antholin
- St Benet Paul's Wharf
- St Christopher le Stocks
- St Dionis Backchurch
- St Dunstan in the East
- St Helen Bishopsgate
- St Lawrence Jewry
- St Margaret Moses
- St Martin Orgar
- St Mary Aldermanbury
- St Mary Aldermary
- St Mary le Bow
- St Mary Magdalen Milk Street
- St Mary Mounthaw
- St Mary Somerset
- St Matthew Friday Street
- St Michael Bassishaw
- St Michael Cornhill
- St Olave Hart Street
- St Peter Cornhill
- St Peter Paul's Wharf
- St Stephen Walbrook
- St Thomas the Apostle
- St Vedast Foster Lane
- St Botolph without Bishopsgate
- St James Clerkenwell
- St Katharine by the Tower
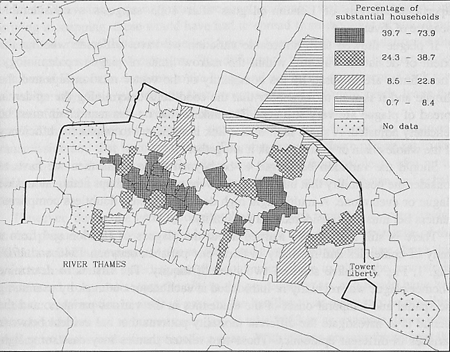
Fig. 2.
The Study Parishes Classified on the Proportion of Substantial Households in the 1638 Listings (2)
Bubonic plague is, though, a disease showing small variation for despite the spread during the last one hundred years of the bacillus of Yersinia pestis to at least two hundred rodent species, one hundred species of flea and all the ethnic groups, there is still only one serotype. This suggests antigenic stability and enables us to relate the biology of modern plague to plague in the past with some confidence and thus to compare modern outbreaks with those of earlier centuries. As Ann Carmichael has stated,
unless there is very persuasive, unassailable evidence to the contrary we must begin from the position that infectious diseases, including Y. pestis in human communities of the European late Middle Ages are similar in both epidemiological and clinical presentation to analogous twentieth-century infections. (3)
Given this stability of plague it is therefore surprising to find that 'seventeenth-century plagues did not invariably exhibit identical characteristics and a more superficial analysis of London plagues after 1603 suggests a considerable measure of diversity'. (4)
If plague showed such noticeable variation we have to decide whether the extent of deviation was still within the narrow limits of plague epidemiology. These limits are imposed by the complexity of the vector relationships and the climate and it is well to remember that the conditions determining the epidemic spread of plague are very stringent. The links in the rat-flea-man chain must be delicately adjusted. A slight fault in one link is sufficient to impair the efficiency of the whole chain or even to break it altogether.
Should the variation be judged to be beyond these limits then we have to consider the possibility that other diseases were present, perhaps acting alongside plague or even alone. A multi-origin high death-rate would doubtless complicate matters but must be considered as a possibility.
There is still much to be learned about the plagues of London and from a study of epidemics and mortality in thirty-one parishes between 1540 and 1700 (Fig. 1, Fig. 2) I have selected two lines of inquiry. The first is to determine whether plague was regularly re-introduced at each major outbreak by examining the spatial and temporal onset of the epidemics in the various parishes; and the second is to investigate the different mortality patterns that are evident between parishes in different epidemics . These two related themes may cast some light upon the variation in London plagues.
Introduced Plague?
Shrewsbury was convinced that plague in London died out from time to time as the virulence of the bacillus diminished. Then, when fresh, virulent strains were re-imported these produced 'unrecognized epizootics' and epidemics in the human population. (5)
Plague virulence may wane in secondary pneumonic outbreaks (those arising secondarily during a primary murine bubonic outbreak) and during primary pneumonic plague (usually from a sylvatic source) but this occurs because the organisms in sputum are passed by inhalation from one victim to another, the bacilli losing virulence with each passage. It is for this reason that epidemics of pneumonic plague come to an end of their own accord.
But in bubonic plague from a murine reservoir the bacilli from a septicaemic rat are received fresh to each person with no person-to-person transfer of the organisms. There is no reason, then, to suppose that bubonic plague in London would have shown the diminished virulence necessary for the re-introduction hypothesis. Furthermore, if new and virulent strains were to be developed there seems to be no reason why they should only have been available from abroad.
If, as Shrewsbury has suggested, the great epidemics were due to new strains arriving in shipping, these would have had to spread from the point of unloading, through the rats of the immediate buildings and across the rat population of the city in a process of slow diffusion. This diffusion is brought about by the transfer of infected fleas from dead rats to the living and not by the movement of sick rats across the city. Rats, particularly Rattus rattus in a cool climate, rarely leave the shelter of buildings even when well and certainly not when sick.
That the diffusion of plague is slow is due to two factors: the rat-to-rat transmission and that from rat to man. The time from the death of one rat to the death of one it infects is about five days, and the time from the death of a rat to the human death between eight and fourteen days (a mean of eleven and a half days).
However, during the great epidemics there was high mortality in every parish so that plague would have to have been in place in time to take advantage of the climatic cue of a temperature rise to 70 degrees F. and a sustained temperature above this level to maintain flea breeding and the epidemic. To be in place the new strain would need to spread across the city in the preceding years and would have had to produce epizootics in order to pass on the bacillus to as many rats as possible. This should have led to human cases yet, to take 1563 as an example, there were no plague deaths in the four preceding years. With plague present throughout the city, the liberties and the out parishes the registers should show a more or less simultaneous beginning of higher mortality in all parishes as the temperature rose.
The alternative to a situation with plague already in place is that a new strain arrived in the year of high mortality and then had to diffuse across the city. If, as Shrewsbury suggests, it came in shipping then we should be able to trace its spread from points along the Thames, although it is very doubtful whether it could have achieved diffusion across the city, the liberties and the out parishes within the space of one short plague season of at most four months.
These are the two epidemiological scenarios to resolve. When the deaths in the parishes are plotted on a weekly basis we can see when the epidemic began in each parish and thus provide an answer to this question. In addition we need to know whether there was any pattern in the process or whether epidemics began randomly in the several parishes.
When this is done it shows three important features. First of all, and in very general terms, for there are many aspects of variance that could only be covered in a longer discourse, there was a tendency for outer, poor and large parishes to show the first signs of increasing mortality. In 1563 the first two weeks of July saw deaths increase in eight parishes, five of which were peripheral. One of these, St Botolph Bishopsgate, is important in the epidemic pattern; it was large and poor (Fig. 2), with less than one per cent of households being substantial. (6)
In 1593 the first parish to show increased mortality was again St Botolph but this was very early in the year, during the week beginning 15 April, and this must be considered extraordinarily early for bubonic plague. In that year one other parish, St Mary Somerset on the Thames, began to show increased burials at the end of April.
The second feature of interest, seen in both 1563 and 1593, is that in the same way that outer parishes were the first to show increasing mortality so, in general, the central rich parishes were the last to begin the epidemic, there being a progression in the onset of higher deaths from the outer parishes to the inner ones. This is a simple observation of events in a time sequence; it does not necessarily mean that a specific disease was beginning peripherally and spreading inwards. It may have been but other evidence is needed before we can be sure.
The third point is the time interval between first and last parishes to show increased mortality. In 1563 the first parish began in the week beginning 1 July and the last in the week beginning 27 August. With the early start of the 1593 epidemic there was a much wider time span; St Botolph started in the week beginning 15 April and the last parishes, three in the west central part of the city, did not show increased deaths until the week beginning 6 August, almost four months later. Once again there was a broad movement from peripheral to central parishes in commencement times with parishes north of a line running roughly north-west to south-east across the city being affected before early July and those south of the line after that date.
This pattern was repeated in 1603. St Botolph was again the first parish to show increased burials in the first week of June. Again, those parishes north of a line running from the west end of St Olave in Hart Street in a north-westerly direction to Aldersgate had begun by 7 July, the parishes to the south starting between then and 17 September. During that week the last parish showed an increase in deaths; this was St Mary Somerset which, it will be remembered, had begun during late April in 1593.
St Botolph was again the first parish to show signs of increasing mortality in 1625 but this was even earlier than before, during the week beginning 11 March. St Katharine by the Tower had increased burials at the end of April but it was not until the week beginning 13 August that deaths began to increase in St Stephen Walbrook in the city centre. This was the last parish to start in that epidemic. The pattern in 1625 again showed that parishes in the north and east all had increased burials by the end of June. Thereafter there was a progressive series of starts towards the south-west part of the city.
In 1665 there was a long time interval in the beginning of the epidemic, from 20 May in St Michael Bassishaw to as late as 1 October in St Matthew Friday Street. Unfortunately, no registers have survived after June for St Botolph.
There was a less orderly pattern to the beginning of high mortality in 1665; during the week beginning 3 June burials increased in St James Clerkenwell and St Benet, Paul's Wharf, two parishes a long way apart. A month later, in the week beginning 1 July, deaths increased in three parishes in the southern half of the city, two of them, St Mary Somerset and St Dunstan in the East being on the river although well apart. A week later, 9 July, St Katharine by the Tower, St Olave Hart Street and St Peter Cornhill had increased mortality and during the week beginning 30 July eight parishes began together. Four of these were close together in the west of the city but the rest were scattered.
There is, then, little evidence of maritime introductions during the five major plague years and much to suggest that the high mortality was due to disease organisms that were already in place, in and around the city. There are many puzzling aspects of the great epidemics but the outstanding one must be the long period between the time when first and last parishes began to show an increase in deaths. If bubonic plague was present throughout the city and was the main disease responsible for the high mortality, then as the temperature reached the point where flea breeding was initiated there should have been an increase in burials more or less simultaneously.
That there was this wide degree of variation is a strong argument against plague being the sole cause of the high mortality.
Endemic or Variation In Mortality Patterns: A Case for Multi-Origin High Mortality?
The long period of time from first to last parish to show increased deaths may be explained when deaths are plotted weekly in each parish from the beginning to the end of the epidemic. It can then be seen that significantly different mortality patterns existed amongst the parishes during plague years and at least three types of mortality curves can be identified (Fig. 3a, b, c).
Typical of bubonic plague or any other disease with a steady incremental build up to the peak of deaths is (a) from All Hallows London Wall in 1625. In this instance the increase phase was less steep than the decline and although this was often a feature of modern plague between 1894 and 1920, (7) it can be seen in other disease mortality curves also.
The second pattern (b) shows a long drawn out epidemic lacking the regularity of the plague curve. Most usually, there is in this type an early increase above normal burial levels and then, with small peaks and troughs, this elevated level may last for several months. In this extended type in St Katharine during a minor plague year in 1609, the increase began in mid April and deaths were still higher than normal at the end of December.
Fig. 3. Mortality Patterns
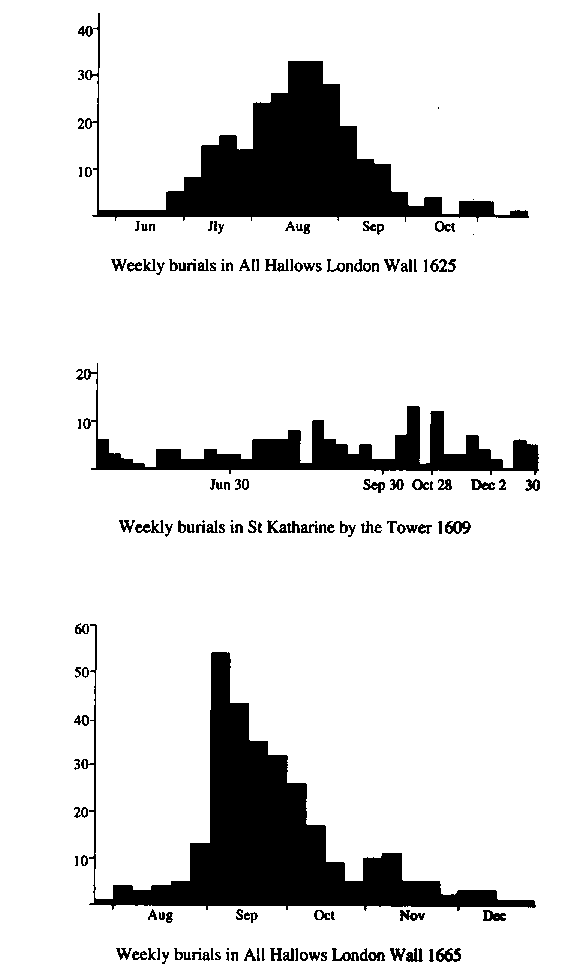
In the third type (c) the onset is abrupt and the curve form owes its shape to the fact that as the temperature rises the organisms in, for example, drinking water divide rapidly so that within a few hours the source is heavily contaminated. If this is a public supply then all those using it will become infected almost simultaneously and become ill and die within a very short space of time. Many deaths occurring within the first few days give rise to the steep form of the mortality graph. From modern experience a pattern such as this resembles cholera or typhoid fever where drinking water or a food source has been contaminated. In (c) there was an abrupt rise at the end of August when deaths increased from thirteen to fifty-four in one week. In this type of epidemic the decline phase is always less steep than the increase and the epidemic may smoulder on for several weeks, especially when the source of the disease is not understood.
The mortality patterns of plague type (a) and enteric type (c) were both seen in All Hallows London Wall in 1625 and 1665 respectively. However, all three mortality types, the plague, the extended and the enteric can be seen during the same epidemic year in different parishes in the city.
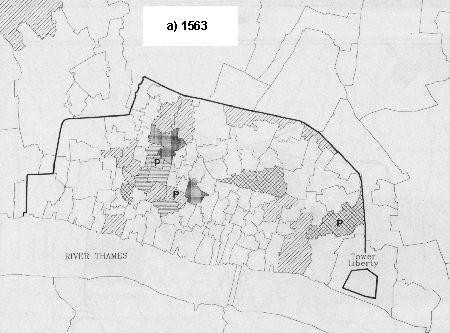
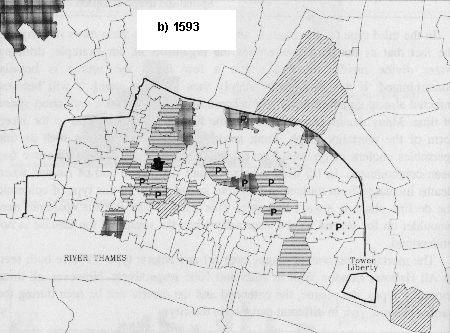
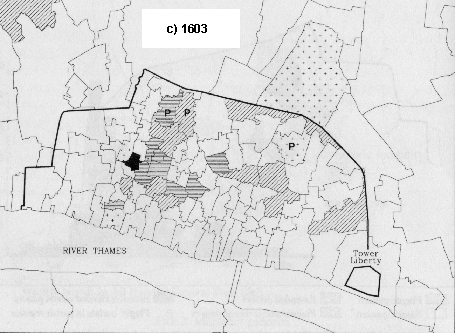
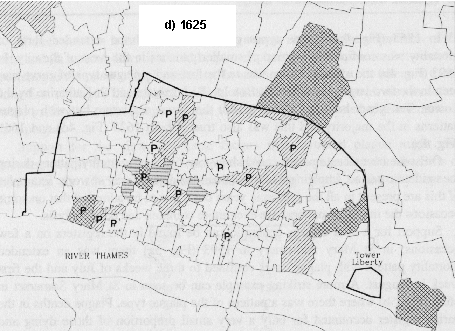
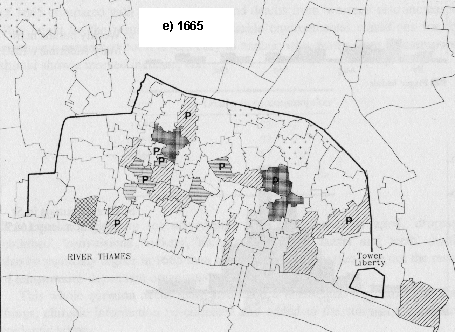
Fig. 4. Distribution of Mortality Patterns in Plague Years
![]()
![]()
![]()
![]()
![]()
In 1563 (Fig. 4a) plague types predominated and the extended form of mortality was confined to a group of smaller parishes in the west of the city. In 1593 (Fig. 4b) the extended form was to the fore and a plague type of curve was seen in the two large parishes of St Botolph Bishopsgate and St Katharine by the Tower. Ten years later in 1603 (Fig. 4c) there was a mixture but with plague patterns in the majority and this was also true of both 1625 (Fig. 4d) and 1665 (Fig. 4e).
On some occasions a parish could show two types of mortality pattern during the epidemic period, implying that more than one disease was at work. Examples of this are present in all the epidemic years but it has to be admitted that on some occasions the mortality patterns are even more complex and defy analysis.
Support for a dual disease epidemic can be found in the registers on a few occasions; in St Mary Aldermary in 1593 (Fig. 5a) there was an extended mortality pattern with plague cases confined to three weeks of July and the first week in August. A more striking example can be seen in St Mary Somerset in 1625 (Fig. 5b) where there was a pattern of the plague type. Plague deaths in the parish register accounted for only a very small proportion of those dying and were recorded between the last week in May and the first week of July. Most of the total deaths took place later and the epidemic came to an end in September.
Fig. 5. Mixed Epidemics
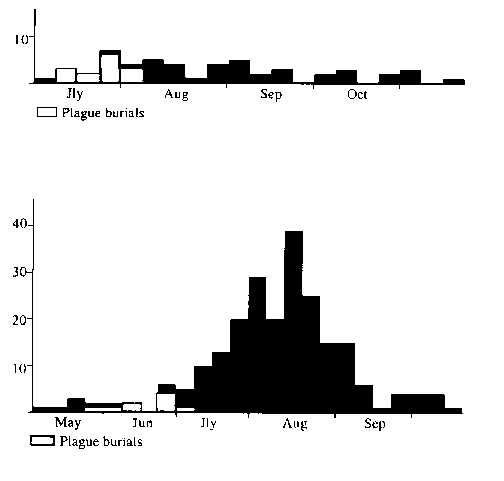
If there were at least three different organisms acting on the population of the city and its surroundings it would help to explain the discrepancies between the parishes in the onset of high mortality. In addition it might also be relevant to the long lists of plague 'diagnosticks' which, whilst mentioning buboes, also include a wide variety of other symptoms that would not be considered characteristic of true plague.
Support for the view that those factors that favoured plague might also increase deaths from other environmental organisms can be found in the Bills of Mortality for 1665. As just one example, 'feaver' deaths in the city rose as follows:
| Year | Deaths from 'feaver' |
|---|---|
| 1655 | 15 |
| 1657 | 43 |
| 1659 | 78 |
| 1660 | 62 |
| 1663 | 44 |
| 1665 | 383 |
Deaths from 'spotted feaver' increased twenty-fold in some of the summer months of 1665 compared with previous years and deaths from 'wormes' also increased. This might be the result of more favourable environmental conditions for the organisms concerned but it is less easy to explain why deaths from 'consumption' should show a marked increase, viz:
| Year | Deaths from 'consumption' |
|---|---|
| 1655 | 33 |
| 1659 | 52 |
| 1660 | 57 |
| 1663 | 61 |
| 1665 | 174 |
It is equally difficult to see why deaths from such causes as 'aged', 'dropsie', 'childbed', 'convulsions', 'rickets', 'rising of the lights', 'surfet' and 'teeth' should also be markedly higher in 1665 than in previous years for these are not the result of temperature-dependent organisms.
This whole question needs more study and it is essential that, amongst other things, climatic information be collected and added to the story of the London epidemic scene.
St Botolph and the Lesser Epidemics
The events taking place in the great epidemic years tend to obscure the fact that in some parishes, notably St Botolph Bishopsgate, St James Clerkenwell and St Katharine by the Tower, there occurred regularly a series of epidemics whose features have been largely ignored.
In St Botolph these were both frequent and quite severe and in many ways resemble the outbreaks of the plague years. As an example, in 1645 and 1646 in St Botolph there were typical summer epidemics, the monthly distribution of deaths being as follows:
| Years | Jan | Feb | Mar | Apr | May | Jun | Jul | Aug | Sep | Oct | Nov | Dec |
| 1645 | 24 | 22 | 34 | 28 | 28 | 32 | 85 | 128 | 80 | 66 | 36 | 27 |
| 1646 | 31 | 22 | 22 | 41 | 31 | 38 | 98 | 169 | 75 | 39 | 27 | 17 |
Figures in bold emphasize particularly high numbers of deaths
Not only were deaths high in the same months as in plague years but in addition the mortality patterns in St Botolph in these lesser epidemics were frequently identical to a typical plague curve. In some years the extended pattern was seen and on some occasions the pattern resembled the enteric form.
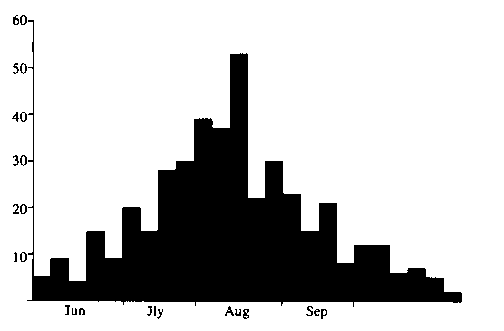
The year 1646 produced a mortality pattern indistinguishable, save in number dying, from a plague year (Fig. 6) with a peak during the third week of August and a return to normal by October. This took place during a plague-endemic period and, if it was bubonic plague, the question arises as to why in that year it failed to spread and what factors would be needed to convert such a year into a city-wide plague year.
Fig. 6. A Lesser Epidemic Year Discussion
Discussion
The difficult biological logistics of repeated introductions of plague for each major outbreak are not supported by the manner in which each of the epidemics developed.
If we consider plague to have been the sole disease organism, then it appears to have been in place by the time of each outbreak and the pattern of development in each of the five years was not dissimilar. If plague began first in the poor, crowded out parishes such as St Botolph this would not accord well with what we know of the biology of the rat, for in modern times it has selected the well to do parts of the city where warmth was greater and food more plentiful. There seems no reason why the same features should not have controlled its distribution in sixteenth- and seventeenth-century London.
It is interesting to note here that the effects of the great epidemics of 1593, 1603, 1625, and 1665 were more severe in the large, outer parishes than the inner ones. This was in contrast to 1563, when the position was reversed with the suburbs and riverside parishes being less affected than the central parishes. (8)
There does not appear to be any good evidence that plague died out from time to time through loss of virulence, for small numbers of plague deaths occurred between the great epidemics and the same parishes regularly functioned as permanent plague foci (Fig. 7). The fact that there were years without plague deaths may merely reflect aspects of the climate rather than a complete loss of the disease but at the moment there is little evidence on this.
Fig. 7. Permanent plague foci in inter-plague years
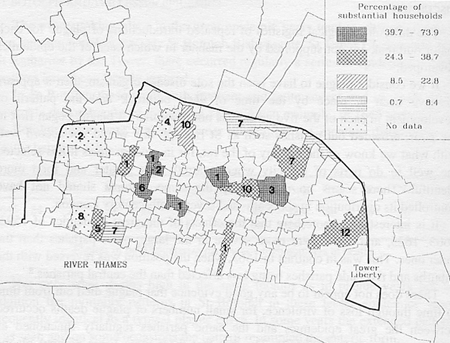
Numbers refer to the number of years when plague deaths occurred. It can be seen that parishes with between 24.3 per cent and 38.7 per cent of substantial households had most years of plague between the major outbreaks (36) compared with no more than 14 in any other category of parish.
The overwhelming part that plague has been believed to play in the London epidemics is curious, for at no time, even during the plague of Canton, has it produced such high death rates. For example, in India plague killed only 0.135 per cent of the population per annum between 1896 and 1917 and death rates in other parts of the world were comparable. In London, though, plague in 1665 is thought to have killed almost twenty per cent of the population whilst in other years even higher rates were recorded in individual parishes.
The dominance of bubonic plague would be reduced considerably by the recognition of at least two other disease patterns, the enteric and the extended forms and whilst it may not be easy to define their origins it is clear that they were different from the plague-type mortality pattern. The latter, it should be noted, is not diagnostic of plague alone and is a common mortality pattern in other diseases. It was, for example, seen in the severe outbreaks of epidemic diarrhoea in early twentieth-century London. (9)
The presence of other disease organisms producing similar mortality patterns to plague would reduce still further the deaths attributed to plague and perhaps this was the situation in St Botolph in 1646. It would not be unreasonable to suggest that the part played by such organisms was important, for the conditions that favoured plague would almost certainly enhance the role of all other temperature-dependent organisms.
It may be countered, though, that the Bills of Mortality, the parish registers and contemporary accounts all speak of 'plague'. Perhaps, after all, this has been translated too literally as bubonic plague, for not long after the last great outbreak a different view prevailed in some quarters. It is unlikely that he had seen plague, at least not in his professional career, but writing in 1721 Dr George Pye expressed his opinion that plague
differs from an epidemic disease, but in degree of violence only; and consequently any epidemic sickness, that rages with more than ordinary violence, and which occasions an extraordinary mortality amongst mankind, may be and is properly termed a pestilence, or the Plague. (10)
If this was so then the difficulty of explaining the presence of bubonic plague at unseasonable times of year, or its movements and behaviour in totally atypical ways, would be removed and we could consider plague as a generic term more appropriate to what was undoubtedly a complex epidemic pool in a large city with regular influxes of immigrants.
To accept a diminished role for bubonic plague in the London plagues and an enhanced position for other diseases would not only help to explain the 'measure of diversity' seen in those epidemics but enable true plague to comprise a proportion of total deaths more in keeping with its complex biology.
Notes
- J.F.D. Shrewsbury, A history of bubonic plague in the British Isles (1970). Back to 1
- Roger Finlay, Population and metropolis: the demography of London 1580-1650 (1981), p. 78. Back to 2
- Ann G. Carmichael, Plague and the poor in Renaissance Florence (1986), p. 8. Back to 3
- John Hatcher, Plague, population and the English economy 1348-1530 (1977), p. 60. Back to 4
- Shrewsbury, Bubonic plague, pp. 222, 315. Back to 5
- Finlay, Population and metropolis, p. 78. Back to 6
- J. Brownlee, 'Certain aspects of the theory of epidemiology in special relation to plague', Proceedings of the Royal Society of Medicine, 11 (1918), pp. 85-127. Back to 7
- Paul Slack, The impact of plague in Tudor and Stuart England (1985), pp. 153-6. Back to 8
- O.H. Peters, 'Observations upon the natural history of diarrhoea', Journal of Hygiene, 10 (1910), pp. 602-777. Back to 9
- George Pye, A discourse of the plague; wherein Dr Mead's notions are consider'd and refuted (1721). Back to 10

